Top farmers are in the know
Rachel Joblin takes a look at the data to see what makes the difference for top performers in the industry.
Rachel Joblin takes a look at the data to see what makes the difference for top performers in the industry.
As a farmer do you wonder if your business is performing well and wonder what can be improved? How can you set some goals for the potential that could be achieved?
Top performers generally know where their business performance lies compared to others and what they do better than most. They also know what their weaknesses are and identify opportunities to improve.
Using data from their own business they can compare it to similar businesses, ones that have similar types of systems to theirs and using a gap analysis approach, can see where the performance of the business can be enhanced.
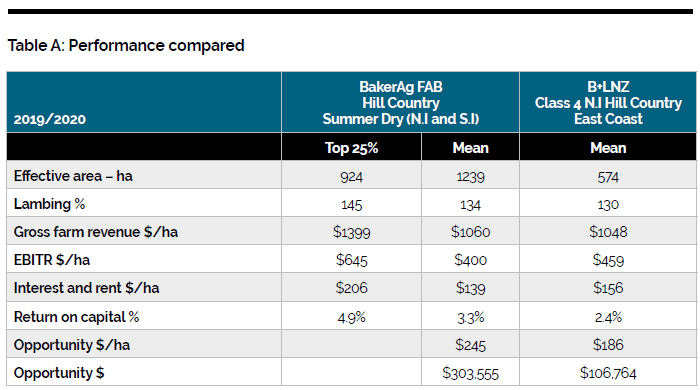
Based on the 2020 BakerAg FAB benchmarking there are some clear characteristics of high-performing sheep and beef businesses. They have a high stocking rate and the ewes lambed 11% higher than the average, providing them more lambs per hectare.
Sheep revenue per sheep stock unit was $20 higher. They achieved a net income $339/hectare more than average and maintaining a tight cost structure means they only spend $94 more a hectare to achieve that income. Interestingly they are more indebted too.
Winter stocking rate was 14% higher than the average group. Well-subdivided paddocks, good soil fertility and a high level of stockmanship is required as the system is highly tuned.
Through this they can maximise the consumption of high-quality spring feed, and ultimately retain quality throughout the season. Top performers use marginally more nitrogen at strategic times of the year, spending $2.73 vs $2.55/stock unit.
There is no significant difference between average and top 25% in their ratio of sheep:cattle. Beef performance is important, although the compatibility of the enterprise to the sheep system is where the value lies. Top performers can squeeze another $13/cattle su.
Sheep breeding efficiency is the driver of these high-performing systems, resulting in an average lambing of 143%. Our knowledge of the businesses shows us they have robust animal health plans, they condition-score ewes and preferentially feed those under BCS3 to ensure the maximum number and kilograms of lambs get to the drafting gate at weaning.
Many are mating hoggets very successfully too, and see this as a lever in their system to fully utilise the feed grown, or to back off the demand in a poor autumn and winter.
We know that the FAB Top 25% of farmers spend less on cropping than an average farmer, but in the 2020 East Coast drought spent more on feed and grazing. They leverage from the cropping spend they do make to ensure it is utilised by the highest returning stock class.
Generally, in these systems it is ewes under body condition score 3, and feeding ewe hoggets to ensure two-tooths are well grown and ready for a highly productive lifetime. During the prolonged dry, supplementary feed and off-farm grazing was utilised to lock in capital stock liveweights, or at least to mitigate weight loss.
The key theme here is that investing in crops and re-grassing is a big expense, top performers manage to feed this to the right stock class, at the right time to have the most positive impact on their business. In the last few years this has typically been to put extra condition on lighter ewes, or ewe hoggets to meet their liveweight targets.
Top performers in FAB benchmarking were able to generate a return on total farm capital of 4.93% vs 3.3% (FAB) or 2.9% (B+LNZ). The top businesses return three times what the average are able to. This number really begins to matter when business growth, investment into capital projects or other assets and business transition are business drivers, which is applicable to most business owners. The ability to fund additional activities or be a good proposition for external finance hinges on this number.
Working out the potential size of the prize for your business is a good place to start. It’s eye opening and motivating. When comparing the FAB Top 25% against the FAB Mean and B+LNZ Mean there’s a hefty reward for lifting performance, at over $186/ha in additional EBITR whichever way you analyse the data.
At the time of writing the B+LNZ quintile information for the 2019/20 year was not available but would paint a similar picture. Using a service like FAB allows timely comparison and highlights the opportunities for your business.
Having this information won’t change your business performance, it’s the actions thereafter that change the results. With the added motivation of knowing what you’re aiming at it becomes easier to take the steps and commit to the changes required. What would you do with your prize?
• Rachel Joblin is an agribusiness consultant for BakerAg, Masterton.