Fertiliser prices – what to do?
Look for the sweet spot when buying fertiliser, soil scientist Dr Doug Edmeades says.
Superphosphate is our staple fertiliser. The price of super has typically been in the range $300–$350 a tonne (t) during the last decade (see Figure 1) but has recently spiked to more than $500/t, mimicking what happened during the Global Financial Crisis in 2008. The temptation in these circumstances is to withhold fertiliser inputs. And it is a real temptation, given that fertiliser is often the largest item of discretionary expenditure in the budget – the average dry-stock farmer spends about $83,000 a year.
If you are tempted to withhold inputs, I suggest you think again.
Remember the past. In the mid-1980s subsidies on fertilisers were removed. Many farmers, caught with this sudden rise simply could not afford to apply fertiliser. A later survey (1990) revealed the financial consequences: For those farmers who continued to apply fertiliser (at least > 100kg/ha) their gross revenue and expenditure were $441/ha and $291/ha respectively, leaving a profit of $151/ha. For those who withheld fertiliser inputs, the gross revenue and expenditure were $253/ha and $207/ha respectively with a profit of $46/ha.
The old adage remains – nobody goes broke putting on fertiliser!
At this same time, several on-farm trials were conducted looking at the effects of withholding fertiliser inputs on pasture and animal production. The rule of thumb that emerged from all this science is that production will decline by about 5% a year if no fertiliser is applied, assuming you are starting with a soil with adequate fertility.
Since then, we have learned some other tricks to cope with rising fertiliser costs. One is obvious when you think about it. Figure 2 shows the generalised relationship between soil fertility (in this case soil Olsen P) and relative pasture production. Note the relationship is not linear. When the soil fertility (Olsen P) is low, large increases in pasture production can be achieved by applying fertiliser and increasing the Olsen P. The dollars you make from the extra pasture produced are greater than the cost of applying fertiliser – i.e. fertiliser inputs are economic.
When the soil fertility (Olsen P) is high, the dollar benefits arising from any increase in pasture production are much less than the costs of applying fertiliser – fertiliser inputs are not economic. What we are looking for is the “sweet spot” – the economic optimal soil fertility (Olsen P) – the region on the graph were the long-term profitability is optimised – the economic optimum. This should not be confused with the agronomic optimal.
The economic optimal is determined by how many dollars you make for each kilo of dry matter grown and this, in turn, is determined by the gross margin – the gross income minus the variable costs (animal health, supplementary feed, shearing and electricity). The higher the gross margin, the higher the economic Olsen P (Figure 3).
The average gross margin at present is about $120/stock unit (su) and the greater the stocking rate (su/ha) the higher the gross margin (GM)/ha, and hence, the higher the economic optimal Olsen P (Figure 3).
Using this information provides a good basis for rationalising the fertiliser bill.
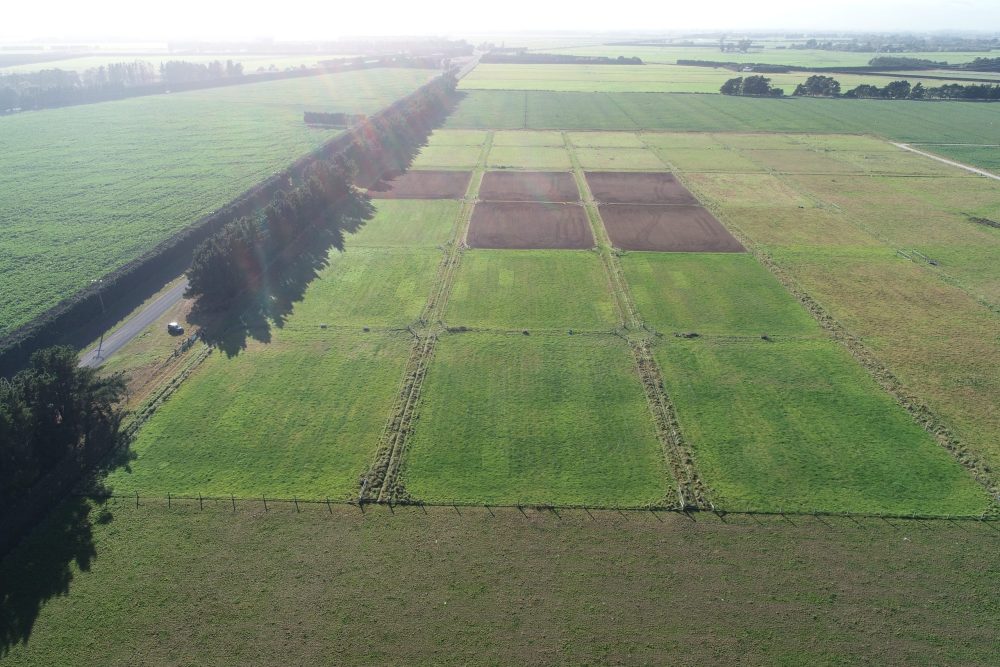
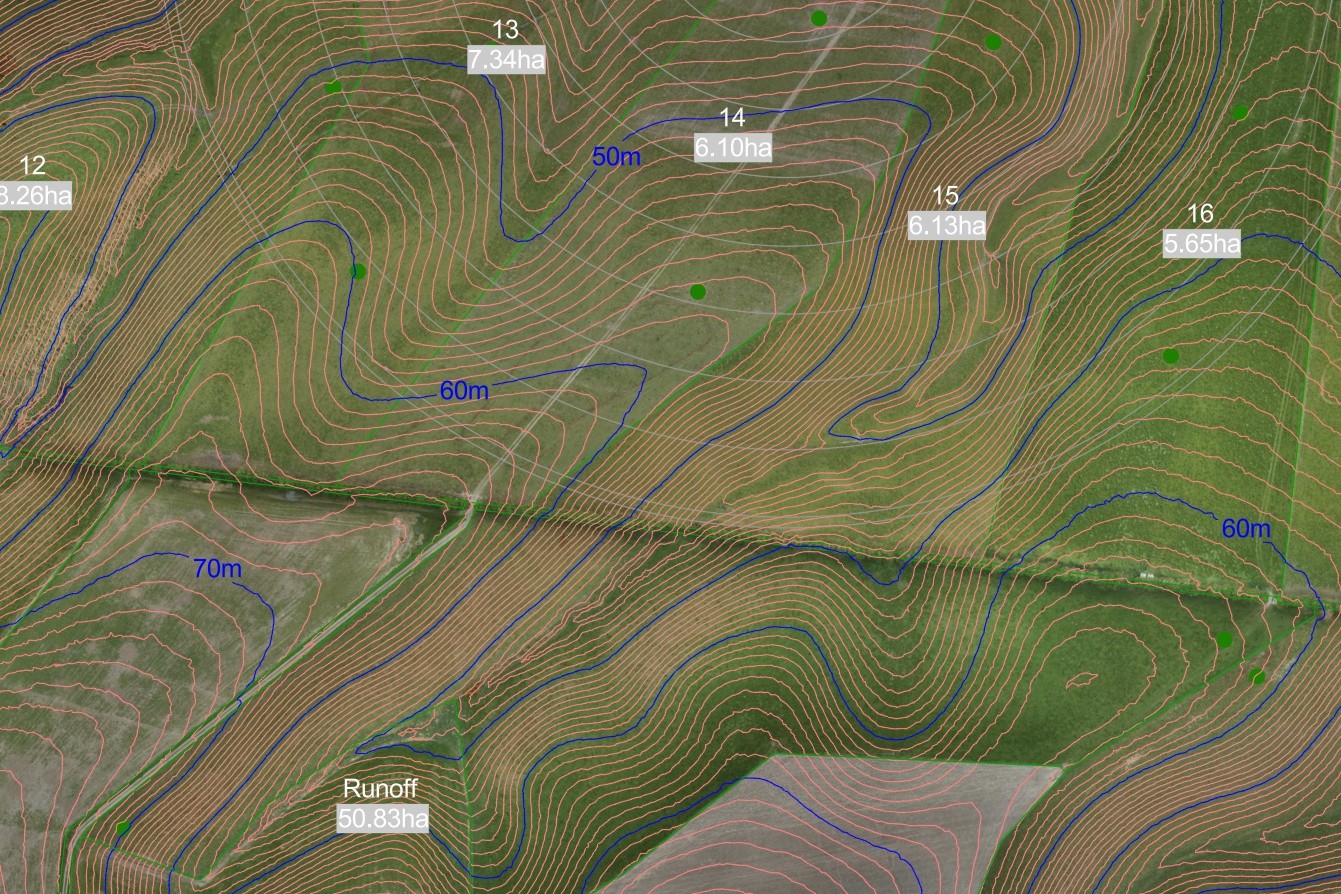
Divide the farm into blocks of different economic efficiency
This may be based on land class or topography. For example, the potential stocking rate on the better class of land may be say 14–16 su/ha, which, assuming a gross margin of $120/su, translates to a gross margin/ha of about $1600 to $1900 a hectare. With reference to Figure 3, this suggests that the economic optimal Olsen P is in the range 20–25. At the other extreme, the steep hill country block may only support 6–8 su/ha (i.e. gross margins of $700 to $900/ha) indicating that the economic optimal Olsen P should be in the range 10–15. By the same logic, the economic optimal Olsen P for the middle country (rolling to easy hill country) will be in the range 15–20.
So, step one in the rationalisation programme should be to divide the farm into blocks based on their economic potential (GM/ha). The days of applying the same rate of fertiliser across the whole farm should be gone! This knowledge will also help you set fertiliser priorities – the better the class of the land the higher the priority in terms of fertiliser expenditure. This may mean that as an interim measure to minimise the fertiliser budget no fertiliser is applied to the poorer country.
Importantly, remember there is no economic benefit in farming above the economic optimal soil P levels and this applies to all blocks. We frequently come across cases where, as a result of past fertiliser inputs, the Olsen P levels are above the respective economic optimal ranges. In these cases, fertiliser P inputs can be withheld for a period, mining the soil Olsen P levels down to the optimal range. This will have no effect on production in the short term, noting that the rate of decline in the Olsen P when fertiliser P is withheld is about 1–2 Olsen P units a year. In some cases, there will be sufficient plant available P in the soil tank to keep production ticking along for several years. The same does not apply to the more mobile nutrients, potassium (K) and sulphur (S). Unless the soil K and S levels are excessive, annual inputs are always required to maintain soil levels.
Historically when we talk about fertiliser, the emphasis has been on P. Farmers, with encouragement from the fertiliser industry, have focused on fertiliser P inputs and Olsen P levels. Consequently, while we have done a good job with P, we have forgotten about the other important nutrients required to grow good clover-based pastures.
This is where Liebig’s “law of the minimum” comes into play. It states that a plant can only grow as fast as the most limiting nutrient and we know from our clients that about 60–70% were, when first visited, farming on soils that were initially K or S deficient, and often soil P levels were in the economic optimal range. In other words, the soil fertility was not balanced.
In these situations, it is not a matter of spending more on fertiliser – the trick is to redirect the fertiliser spend from P to the most limiting nutrient(s). One case I remember well. The farm was extremely deficient K, and, as a remedial solution, we recommended no further inputs of P and S but capital inputs of K. Fertiliser costs did not increase but the pasture production was increased by about 20% by chasing down the most limiting nutrient.
Also, do not forget about the trace elements, and in particular molybdenum (Mo). Mo deficiency was first discovered in New Zealand in the early 1950s and tiny amounts of Mo (50 gm/ha) added to the fertiliser resulted in massive increases on clover production. Indeed, one of the visual symptoms of Mo deficiency is the absence of clover in the pasture, or simply poor clover growth, even though the soil fertility levels are optimal. Surprisingly, we see this problem frequently.
The last trick in the book to ensure the fertiliser dollar is well spent is to choose the least-cost fertilisers to deliver the nutrients required to optimise the soil fertility. As a rule of thumb, this is best achieved by sticking to the generic fertiliser products such as super, potash and urea and avoiding the branded products.