James Hoban
Merino New Zealand recently ran a series of workshops for farmers considering reducing the micron of their flocks. Some people have already started this process through crossbreeding, while others have moved to finer breeds entirely, and many continue to run strong wool sheep on the basis that they believe meat production trumps everything.
The Merino NZ workshops were attended by a captive audience and the company made assurances that any concerns about fine woolled sheep could be addressed by sourcing the right genetics. What was missing was a compelling financial comparison of strong wool and fine wool flocks.
The following is an attempt to put some figures around different types of flocks. This is a comparison made challenging by the range of flock performance. Pregnancy scanners will vouch for the fact that there are still fine wool and crossbred flocks routinely scanning well below the national average and other flocks, including fine wool, far exceeding the norm. Simply questioning whether a Merino, Corriedale, Halfbred, fine crossbred, Dohne or Samm is more profitable than a Romney, Perendale, Coopworth or composite ewe will not lead to a definitive answer because so much relies on management. There continue to be breeds within breeds. A simpler way to approach any comparison is to look at what level of performance is required from either fine or strong wool sheep to match their counterparts.
WHAT ABOUT THE ANECDOTES?
Generations of farmers loyal to particular breeds have always had theories on the strengths of their favoured sheep. Unfortunately not all of these have been validated or dismissed by scientific studies.
Feed conversion efficiency is one trait many fine wool farmers have claimed is an advantage of their sheep for generations. The theories are that “four Corriedales can be run where only three Romneys can,” or that a Halfbred ewe will eat less than a Romney of the same liveweight, or that crossbreds never sleep but just continually eat, or that Merinos can live on fresh air and good views. Feed budgeting tools all base animal demand on liveweight in a way that does not cater for these theories. The idea that an animal can be heavier – therefore more valuable when sold, with a heavier fleece and bigger lambs – while still eating the same as lighter ewe has obvious appeal but unfortunately it’s never been proved beyond all doubt. AgResearch work on feed conversion efficiency has shown some animals to be curve benders – more efficient than others – and the only fine woolled sheep involved went some way to supporting the old theories. Like many projects though, this trial is awaiting funding support and comes with the usual caveats around the length of the study and application at farm level.
Temperament is another trait attached to breeds by many farmers. While some handling and management influence temperament, most farmers would agree that in general Merinos behave differently to Perendales, for example. Some people continue with mid micron sheep in part because they find them easier to handle. Dogs and shepherds used to crossbreds have been thrown by the behaviour of a fine woolled flock and vice versa.
Longevity is an asset that mid micron producers also claim. A longer-lived ewe reduces the replacement rate and means that ewes can be sold younger for a better price or that extra hoggets or two-tooths are sold. Some farmers at the Merino NZ workshops cited ewe deaths as a concern they had when it came to shifting towards finer sheep. The reality is there are flocks in all breeds with high wastage. The Massey University work, recently reported at Beef + Lamb NZ Farming for Profit days by Kate Griffiths, showed ewe losses as high as over 24% but generally ranging from 8-12%, in a group of Romney-based flocks. Many fine wool flocks will lose a smaller percentage than this while some will lose the same or more.
GROSS INCOME COMPARISON
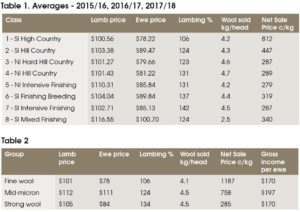
With flocks within all breeds either exceeding or failing to meet common production expectations, identifying genuine averages is difficult. The following comparison uses B+LNZ economic service data to compare average results of crossbred flocks with finer wool options. A range of beef and lamb classes are shown in table one which averages lamb price, ewe price, lambing percentage, wool weight and wool price over three years. Unfortunately there is no farm survey class solely running fine or mid micron wool. Class one South Island High Country is the closest to a sample set of fine wool farms available through the B+LNZ information.
Table two compares an average of all the predominantly crossbred B+LNZ classes with Class one (fine wool) and a mid micron class. Three-year averages are used to compare all three.
The wool price for the mid micron class is based on the mid micron wool price indicator – averaging 45 values for that indicator over three years and converting them to a greasy price at 75% yield. For the mid micron production figures, real farm data has been used, based on eight unnamed Corriedale or Halfbred commercial flocks, all running on hill country. These are predominantly breeding properties. These flocks have a wide range of lambing percentages from 100% to 145%.
The wool price for class one has been increased to remove the influence of strong wool flocks and make it more representative of a Merino sample. An average three-year price for a number of Merino growers has been used.
The North Island classes are almost entirely made up of strong wool farms. To make it more favourable for the strong wool class, North Island Hard Hill country is not included and South Island Finishing/Breeding is. This helps inflate the average lambing percentage for the strong wool.
The Gross income per ewe figure has been created by:
- Multiplying the lamb price by the lambing percentage
- Adding 20% of the ewe price (she is only sold once – five years has been used for all classes)
- Multiplying the wool weight by the wool price and adding it to the above values.
It should be noted that these are averages of available information. Using this information, mid micron ewe values are higher than crossbreds. Longevity and ewe size may influence this. The lamb price is also considerably higher in the mid micron class which may be a function of the number of terminal cross lambs and the added value of a fleece on fine wool store lambs. If the ewe and lamb prices are dropped to be the same values as the strong wool class, it brings the mid micron gross income figure down to $182, still ahead of both fine and strong wool classes.
If a strong flock could refine its wool clip to achieve $5/kg greasy, at the same lambing percentage, it would increase gross income per ewe to $179. If this was done through introducing fine wool sheep in a crossbreeding programme hybrid vigour would help maintain other traits.
People running any breed could argue that these figures do not fairly reflect their flock’s performance or their preferences. However, based on these figures, if the mid micron flock is only achieving 100% lambing it matches the strong wool flock at 134%. Looking at it another way, the strong wool flock does not match the mid micron flock (lambing at 126%) until it achieves 160%. A Merino flock lambing 120% remains well behind mid micron but comfortably ahead of the strong wool class.
An important consideration is whether sheep-related expenses would be the same between fine, mid and strong wool sheep. This will largely come down to management, genetics and farm conditions. Most strong wool sheep are shorn twice annually which is an obvious cost that the fine and mid micron options do not present. Feed and animal health costs can be debated. Flystrike, internal parasites and footrot all need consideration but none of these are limited to a breed of sheep. Regardless of personal biases, any flock performing well in any of these groups will exceed the averages of alternatives.