The outlook for Landcorp
Is there a future in public ownership for Landcorp Farming? Ray Macleod thinks the SOE is far from a shining example for the farming sector to aspire to and says it needs to sharpen its farming act.

Treasury’s independent review on Landcorp Farming was completed by James Morrison Consulting Ltd in 2021, and its observations and recommendations were released in December that year. The review was commissioned as a result of, and I quote:
“…the strategic approach adopted [by Landcorp] in 2014 includes leveraging off its scale and building resilience through diversification of revenue streams, including through creating value in its off-farm ventures. However, performance to date has not clearly demonstrated that the strategic approach is delivering as intended.”
So the review was not intended to consider the future ownership of Landcorp Farming by taxpayers but to identify why it was not delivering operational and strategic results. It found answers in abundance and provided plenty of examples as to why the long-suffering taxpayer should be asking why we own Landcorp? Perhaps the minister is also asking the same question?
As a farming operation Treasury’s independent review observes there are issues with:
- transparency and accountability
- onfarm performance
- off farm performance
- corporate overheads.
That doesn’t leave much left to provide us poor taxpayers with confidence in a rosy future for Landcorp. The independent review is a useful document upon which to base a discussion around future ownership of Landcorp.
With respect to transparency and accountability, I fully support the conclusion of the Morrison review that “Landcorp’s performance has proved difficult to assess because of information shortcomings, lack of transparency and “moving targets”, making it difficult to hold Landcorp to account.”
Having been a long-term reader of Landcorp’s annual reports, they are best described as murky. Sure they meet reporting standards, but the ability to extract good longitudinal comparative data is limited. I’ve always thought this a Landcorp strategy to distract readers from increasingly average performances. And those performances are not just average; across the bulk of Landcorp’s farming revenue lines the farm performance is below average.
The dairy picture
Dairying generated $120 million of milk receipts1 or 48%, to the nearest percent, of the group revenue for the year ended June 2022. Based on the annual accounts, this result doesn’t include revenue from sales of cull cows, calves, purchase of dairy stock or cost of raising replacements, all key components of the operating models in the dairy sector. As an aside, if that is how Landcorp reports its carbon performance, it would make the dairying operation look pretty clean! We don’t get a fix on dairy herd replacement rates or how this impacts the bottom line – things every farmer is critically aware of in their herd performance. This gives a false impression of the dairy operation performance, good or bad, and add to that the unallocated corporate overheads and we have further reason to get lost in smoke and mirrors.
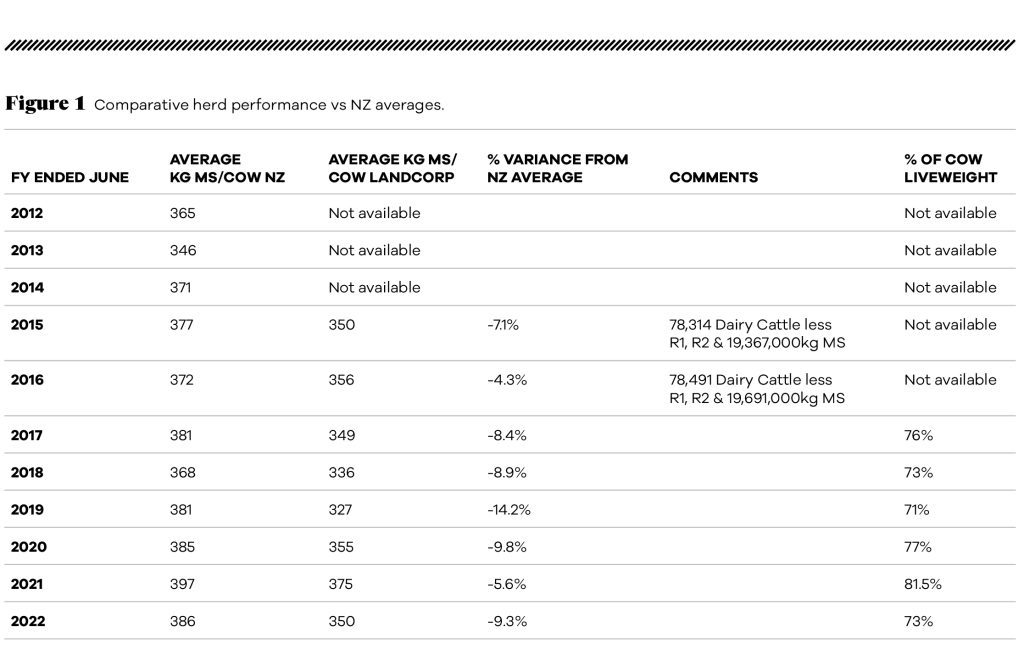
Figure 1 doesn’t make pleasant reading for an organisation that projects itself as being a sector leader. I don’t feel the dairy sector would be racing to Landcorp for advice, except perhaps for what not to do. Per cow production has plateaued in the last eight years and is firmly locked at about 350kg MS/cow/season. Similarly, production as a percentage of liveweight is locked at about 70%. Landcorp performance is eclipsed by the majority of farmers; it is below average, or to be quite firm, it brings the NZ herd averages down. Putting aside the production per cow, because we can always argue cow size may be a contributor, the milk solid production as a percentage of liveweight is telling. Statistics don’t record average dairy cow liveweight2, so having asked around I settled on 500kg liveweight based on a J9 Jersey cross. On this basis for the 2021-2022 season per cow milk solid production as a percentage of liveweight is 77%. Landcorp is still lowering the NZ herd average.

Moving on to other on farm performances the enthusiasm for the corporate effort doesn’t improve. Over the 2020, 2021 and 2022 financial years Landcorp’s lambing percentage, with the NZ flock percentage in brackets3 were 135% (138%), 134% (138%) and 130% (134%). Given the size of the flock, Landcorp’s operating challenges are likely a mirror image of the NZ Inc on-farm experience for the same periods, so these results are unlikely to be unique to Landcorp and are simply below average. Carcase weights are at the low end of the scale at 17.8kgs–17.9kgs, with the NZ average being recorded as 20kg4. The interesting one is sheep deaths at 51,6475 or 13.1% of the total sheep flock of 394,494. A recent study of ewe losses completed by Associate Professor Anne Ridler of Massey University suggests ewe deaths/missing of six animals per hundred6. Assuming the sheep deaths reported by Landcorp are deaths and missing, and I accept this may have been elevated by the sheep dairy operation, it still suggests at 13.1% an excessive level of deaths across the entire Landcorp farming flock. Again this isn’t sector-leading farming performance. We find ourselves agreeing with the Morrison review that Landcorp is a below average performer.
With respect to cattle revenues this includes $31m of dairy cow sales and $8m of purchases in the livestock trading account. What is not evident here is where the costs of raising dairy replacements is allocated. Again the annual report is so deficient, a knowledgeable reader is unable to get a view of divisional performance. Livestock sales are recorded at $127m, or 50% of farm operating revenue.
Sound operating division results would record dairy revenue at $151m and livestock trading, or sheep and beef, at $96m. So livestock trading is overstated and if the annual results are to be used for anything remotely analytical, dairying is understated with livestock trading not allocated to divisions and goodness knows where the operating expenses sit between them. The only thing we can say about the livestock statistics in the 2022 annual report is that carcase weights are likely overstated due to a considerable number of cull cows being in the mix, but then low-performing cows are usually skinny cows.
At 12% of Group revenue, off-farm receipts are not significant and aren’t adding anything to the conversation, other than the Morrison review has expressed a number of doubts about the financial modelling, and I’m of the view that it has probably generated significant overhead, which brings us to the next question. Just how much overhead is Landcorp generating and not allocating to its operational divisions? My best guess, based on what information one can gather about the head office structure, is that there must be a good $20m in corporate overheads, but as the Morrison review observed, it isn’t reported and thus not allocated to the operating divisions. What would that do to the off-farm investment where I suspect most of the corporate overhead is generated?
Landcorp is by no means a stellar performer. It has managed to hide the worst excesses of its operational performance through not allocating its corporate overhead and by making its annual report so murky it is hard to conclude much of use from it. The Morrison review comments at page 34 that Dairy Holdings has 12 non-supervisory staff or about one sixth of Landcorp’s. So to support my thoughts about overhead allocation I have assumed that is 70 non-supervisory staff. I have added up the costs for the top 68 salaried staff (from $140k–$149k to $590k–$599k) and they exceed $14m. Add in maintaining a head office, travel and other operating and employment costs, the unallocated corporate overhead is likely between $25m and $30m. Landcorp’s non allocation of overhead does it no favours and makes me deeply suspicious of why it isn’t allocated.
The only safe conclusion, the one I could rely upon, is that the performance scorecard on page eight of the 2022 annual report is accurate but of no value in scoring Landcorp’s operations with accuracy. Most of this performance report is some sort of social licence tick-box exercise that the market would simply ignore if it were doing due diligence on the operating divisions. But then in my view, a serious due diligence undertaking would ignore the entire annual report.
Landcorp is a perennially poor performer that has drifted away from its core objective of returning an acceptable profit to taxpayers. If it reported and allocated its corporate overhead, which it must for credibility, it would provide a more realistic picture of true operational performance as a state-owned enterprise (SOE). It needs to also report its farm divisional performances as stand-alone operations too, so its farming performance is better understood. There is simply no compelling commercial or other reasons why this is not done.
Questioning priorities
My question is why aren’t senior management and the board strongly focused on making the core operations of farming perform before moving into off-farm investments? Investments Landcorp doesn’t appear to have the managerial skill or resources for which is noted in the Morrison review. Does Landcorp think off-farm investments are going to improve group results without fixing the farming performance issues first? Farming is 88% of group income according to the 2022 annual report, and off farm activities are not trading to any of the lofty expectations! What would they look like with a share of the corporate overhead allocated?
Landcorp is not a special case. All farmers have weather and commodity price challenges and it seems they face more critical performance review processes than an SOE whose shareholders’ representative, the minister, largely leaves them to it. Landcorp’s corporate overhead, as noted in the Morrison review on page 33 is high compared to other SOEs. Landcorp is not a shining example for the farming sector to aspire to, it doesn’t have a mandate to identify itself as some industry-good organisation, which, as noted in the Morrison review, it clearly is not. The priorities are wrong here and are a recipe for failure as senior management and the board pursue lofty off-farm goals that appear to have been poorly modelled and as they check social licence tick boxes in what seems to be a vain attempt to remain under the radar while core business performance is below average. The inevitable conclusion is Landcorp is poor value for money and in my opinion has been hijacked by interest groups at corporate level and it should be sold off to better operators, to owners who will stimulate the economy, continue to employ operational staff and pay tax to the IRD on profits. Landcorp’s reporting, while compliant, is self-serving claptrap and mutual back slapping.
If we put the net reported assets of $1.8 billion into the bank on fixed deposit, we would get a better return. If we built 260 houses at $700,000 each, the social return would be better and if we spent it on mental health, who knows? What I do know is that as a taxpayer I think there could be much better use of our funds.
Figure 2: The numbers of employees and former employees whose total remuneration was within the specified bands. Remuneration is inclusive of benefits including performance incentives, employer superannuation contributions, health and life insurance and accommodation benefits (where applicable). Performance incentives paid in 2021/22 relate to performance in the prior year. Source – Landcorp Annual Report 2022.
| $000 | No. of employees |
| 100–109* | 32 |
| 110–119* | 34 |
| 120–129 | 24 |
| 130–139* | 18 |
| 140–149 | 17 |
| 150–159* | 6 |
| 160–169* | 11 |
| 170–179 | 6 |
| 180–189 | 3 |
| 190–199 | 2 |
| 200–209 | 1 |
| 210–219 | 3 |
| 220–229 | 1 |
| 230–239 | 2 |
| 240–249 | 4 |
| 250–259 | 2 |
| 270–279 | 1 |
| 290–299* | 1 |
| 350–359 | 1 |
| 360–369 | 1 |
| 380–389 | 1 |
| 390–399 | 1 |
| 400–409 | 1 |
| 410–419 | 2 |
| 590–599 | 1 |
1 Landcorp Annual Report to June 2022 Note 2 Farm Operating Revenue p65
2 Animal live weight calculations in the NZ Agriculture GHG Inventory Model – Mike Rollo Agresearch May 2018
3 Stats Dept – agricultural production statistics for the year ended June 2022
4 Beef + Lamb NZ– Annual Reports years ended June 2021 & June 2022
5 Landcorp Farming Annual Report year ended June 2022.
6 Ewe wastage in commercial sheep flocks.
- Ray Macleod is an agriculture economist and director of the consultancy company, Landward Management.
View Treasury’s independent review on Landcorp Farming at: bit.ly/3OmVvPm


