The cost to produce a lamb
BakerAg ag consultant Rachel Joblin takes a look at data and comes up with the changes in lamb production costs for the past 14 years.
BakerAg ag consultant Rachel Joblin takes a look at data and comes up with the changes in lamb production costs for the past 14 years.
In 2007 and 2016 Sully Alsop, whilst part of the BakerAg team, crunched some numbers to estimate the cost of producing a lamb. We look at what has changed since then and know there will be more changes to come through the 2022- 2023 financial year. The methodology has been kept the same for consistency, and in the past has come under some fire. We gather quality data from the industry and it is how we allocate the costs to lamb that can be contentious. It is an academic exercise looking at key costs of producing a lamb.
The method in 2007 and 2016 was:
- Start with all the costs to run a farm
- Subtract all the non-lamb income (cattle, wool, cull ewes)
- The remaining costs are the net cost to produce lambs. Divide this by the number of lambs available for sale (excludes replacement ewe lambs).
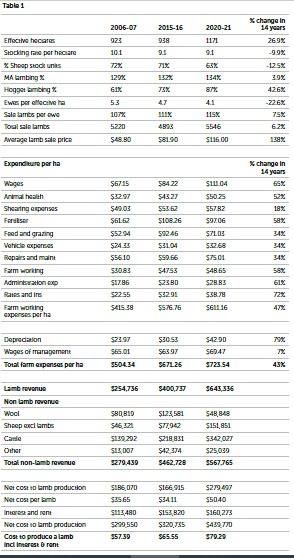
Using BakerAg FAB benchmark data that we have been collecting for 30 years, we can see the results in Table 1.
The standout is that our farm systems have changed since 2007 in the following ways:
- The effective area has increased by 27%
- The overall stocking rate has reduced by 1 su/ha
- Sheep ratio has dropped to 63% from 72%
- Lambing percentage in ewes and hoggets has increased
- Our farms are more efficient than when we first started tracking the cost of producing a lamb as measured by sale lambs/ewe.
Expenditure
Expenditure tells the big story. Farm operating costs have increased by 47% since 2007. Unsurprisingly the big increases are in wages, animal health, fertiliser, farm working, administration, rates and insurance. Some of the real changes in input prices are not reflected as we know there have been changes to quantity of inputs offsetting some increases. An example of this may be changing fertiliser policy, reducing the amount of maintenance undertaken or a stock policy change, such as increasing the cattle ratio that reduces animal health.
Considering the increase in farm working expenses and knowing what is happening on farms, it is fair to say there are considerable investments being made in tree planting for erosion control, water quality and biodiversity work. Health and safety expenditure, weed and pest control and dog expenses would also be included in the category.
The biggest expenses are labour and fertiliser and these both have jumped in recent years, although as a portion of total expenses are still similar.
Debt servicing per hectare has lifted 11% since 2007 but there have been several cycles of increases and decreases during this period. If we run the numbers again for 2023 I am sure it will show the pain that borrowers are feeling now.
Income
Revenue (excluding lamb sales) has increased by 103%, so just over doubled. It’s not all good news with wool income falling by 40%. Lamb revenue has increased 152%. This reflects the increase in farm area, more lambs/ewe and a significant increase in average schedule prices to $8.88/kg across the season compared to $4.01/kg back in 2007.
Cost to produce a lamb
The cost to produce one lamb, excluding interest and rent (I&R), has increased 41% in 14 years. An average annual increase of 2.93% a year shows it runs higher than the annual average inflation in New Zealand during this time of 1.9%.
If I&R are included then the cost has increased by $21.90/lamb.
Increasing efficiency
What can farmers influence to reduce the cost of a lamb? Reducing costs is difficult, particularly in a highly inflationary environment. The devil is in the detail to ensure each dollar spent is directed to the highest returning opportunity. Re-evaluate systems, animal health, fertiliser, maintenance and cropping programmes. In some businesses there is not much cost to cut that will not affect production, but looking at a gross margin level may show that the marginal income is lower than the marginal cost for some items.
Improving efficiency factors such as the lambing and calving percentage, growth rates, and sale weights will spread expenses over more sales. Increasing lambing in ewes by 5% reduces the cost of a lamb by $2.52 without rates and insurance (R&I) or by $3.96 including R&I. Could hogget lambing be an opportunity, or refining the cattle system? The more income from non-lamb sales then the lower the cost of lamb production. Efficiency is the key opportunity to make the escalating expenses hurt less. Easier said than done? Possibly. But not impossible.
REAL VALUES
According to inflationtool.com, $100 in 2016 was $126.32 in 2022 while $100 in 2007 is $149.04 today.
The value of $100 in 1990 is now $212.18 – Editor
- Rachel Joblin is an agribusiness consultant with BakerAg.

