Farm consultant Kerry Dwyer works the numbers to find the cost of producing a lamb and that farmers are running a high input cost system.
Sheep farming in 2022 is all about meat production, to the extent that SIL have dropped wool out of their maternal breeding index. This might be less true if you have Merinos, but meat is becoming a larger income item for them also.
So what is the cost of producing lambs?
We could do a set of figures for an example farm, working out input costs relative to production. Instead, I used the extensive database of figures available from Beef + Lamb Economic Service, which surveys a wide range of businesses around the whole of NZ. They categorise farms into different regions and classes of land type and provide regular updates to figures. Income is broken into types of stock produced and sold, along with wool and any other income streams. Costs are surveyed into three groups. Farm working expenses is made up of cost of wages, animal health, weed and pest control, shearing, fertiliser and lime, seeds, vehicle and fuel costs, electricity, feed and grazing, irrigation, cultivation and crop costs, repairs and maintenance, freight, and administration.
Standing charges are insurance, ACC levies, rates, managerial salaries, interest and rent. The third is depreciation. So a good analysis of the full cost of production.
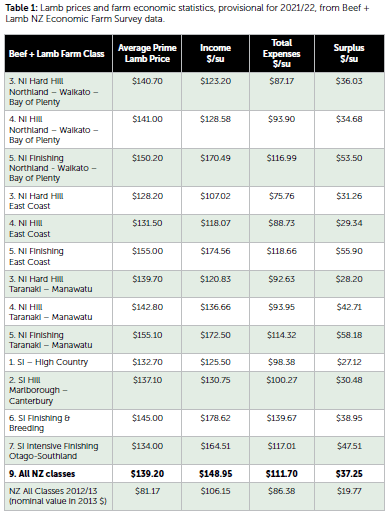
The table shows the relevant data for lamb production costs, for 13 different classes of sheep and beef farms, provisional for the year to June 2022. The Economic Service provides average prices received for both prime and store lambs, which are produced in varying proportions by the various classes of farms. I have listed the prime lamb average price only, as an indicative figure relative to the average income per stock unit.
The lambing percentage achieved by the average farms means the number of lambs sold is fairly close to the number of ewes wintered on most farms e.g. a lambing of 133% allows for three quarters of the lambs to be sold while retaining a quarter as replacements. A higher lambing percentage allows for proportionately more lambs sold which will increase income per stock unit.
Wool income for crossbred flocks has been close to shearing and wool selling costs for the year, so has had minimal influence on per stock unit income. The sale of surplus breeding ewes adds to the per stock unit income, but for simplicity I would allow that it covers the cost of rearing the replacements to breeding age.
There is variation between the farm classes for all the figures listed: A $27/head range in prime lamb price; $71/su range for income/su; $64/su range in expenses/su; and a $29/su range in surplus/su. Those can largely be explained by the variation in land class which affects production (lambing percentage and lamb growth rates), the costs of farming the various land class, and the difference in scale seen.
The average prime lamb carcaseweight (CW) sold last year was about 19kg. That means the NZ average prime lamb sold returned about $7.35/kg CW to the producer. Using the expenses/su as the cost of production, we have $111.70/lamb, equalling $5.90/kg CW. We can relate that to liveweight by assuming a dressing percentage of 42%, to reach a cost of production of $2.50/kg liveweight.
Assuming all lambs are sold at similar weights (which is not true) the cheapest cost of production might be achieved on the NI East Coast Hard Hill country farms at $4/kg CW and $1.70/kg liveweight. The fact is that the great majority of lambs sold off that class of farm are stores, at a lighter weight, so that figure is likely an underestimation.
I suspect the cost of production will have a greater range within farm classes than between the different classes i.e. there are some businesses within each class that are far better or not as good as the average, than the range shown between farm classes in the table.
As a comparison I have also shown the NZ average statistics from 10 years ago. It would appear that in 2012/13 the average lamb sold for the less than the cost of production. It had a production cost of $4.80/kg CW or $2/kg LW. It was a tough year for sheep farmers, but wool prices were better than today.
The most recent statistics put the NZ sheep flock at 25.78m total sheep, of which 16.1m are breeding ewes. That is a drop from about 32m total sheep in 2012. We also have 3.93m beef cattle of which 1.06m are breeding cows.
As sheep farmers we strive to be profitable, by controlling inputs and maximising production. Business modelling generally shows that output is proportional to inputs i.e. there are very few places where you get high output from low input. The figures in the table show that NZ sheep farmers are not running low input systems, even on the NI East Coast, when judged by a global standard. The average ratio of total expenses per stock unit to income per stock unit ranges from 68% to 78% of income, averaging 75%.
The El Dorado is to have low cost sheep producing well above the national average. Technology may help us get there.
- Kerry Dwyer is a North Otago farm consultant and farmer.